Multi-Frequency Electrical Impedance Myography as an alternative to Electro-Myography
Imagine that one way or another you lose your hand. Various daily tasks which used to be an easy job might now be difficult to perform. Luckily in the 21st century it is possible to use a robotic prosthetic hand. At this moment multiple robotic prosthetic hands are already produced and used [1]. Most of these prosthetic hands make use of Electro-Myography (EMG) in combination with pre-configured hand positions [1]. However, the use of pre-configured hand positions makes it impossible for the prosthetic hand to make every move a human hand can make. In order to detect and recreate every human movement, a relationship should be found between (desired) muscle force, movement, and a measurable signal such as EMG or Electrical Impedance Myography (EIM).
Electrical Impedance Myography
Electrical Impedance Myography focuses on the electrical impedance of a muscle or muscle group. Using a four points measurement and skin surface electrodes it is possible to calculate the impedance of a part of the human body. During this study, the electrodes are placed on the upper arm to measure the impedance of the bicep brachii, as shown in figure 1. EIM has a few benefits over EMG. EIM can be performed from 0Hz up to the Gigahertz range, while EMG has a bandwidth from 0 to 500 Hz. Besides, during one measurement instant multiple measurement frequencies can be used simultaneously. Therefore more information can be extracted from the state of the muscle per measurement.
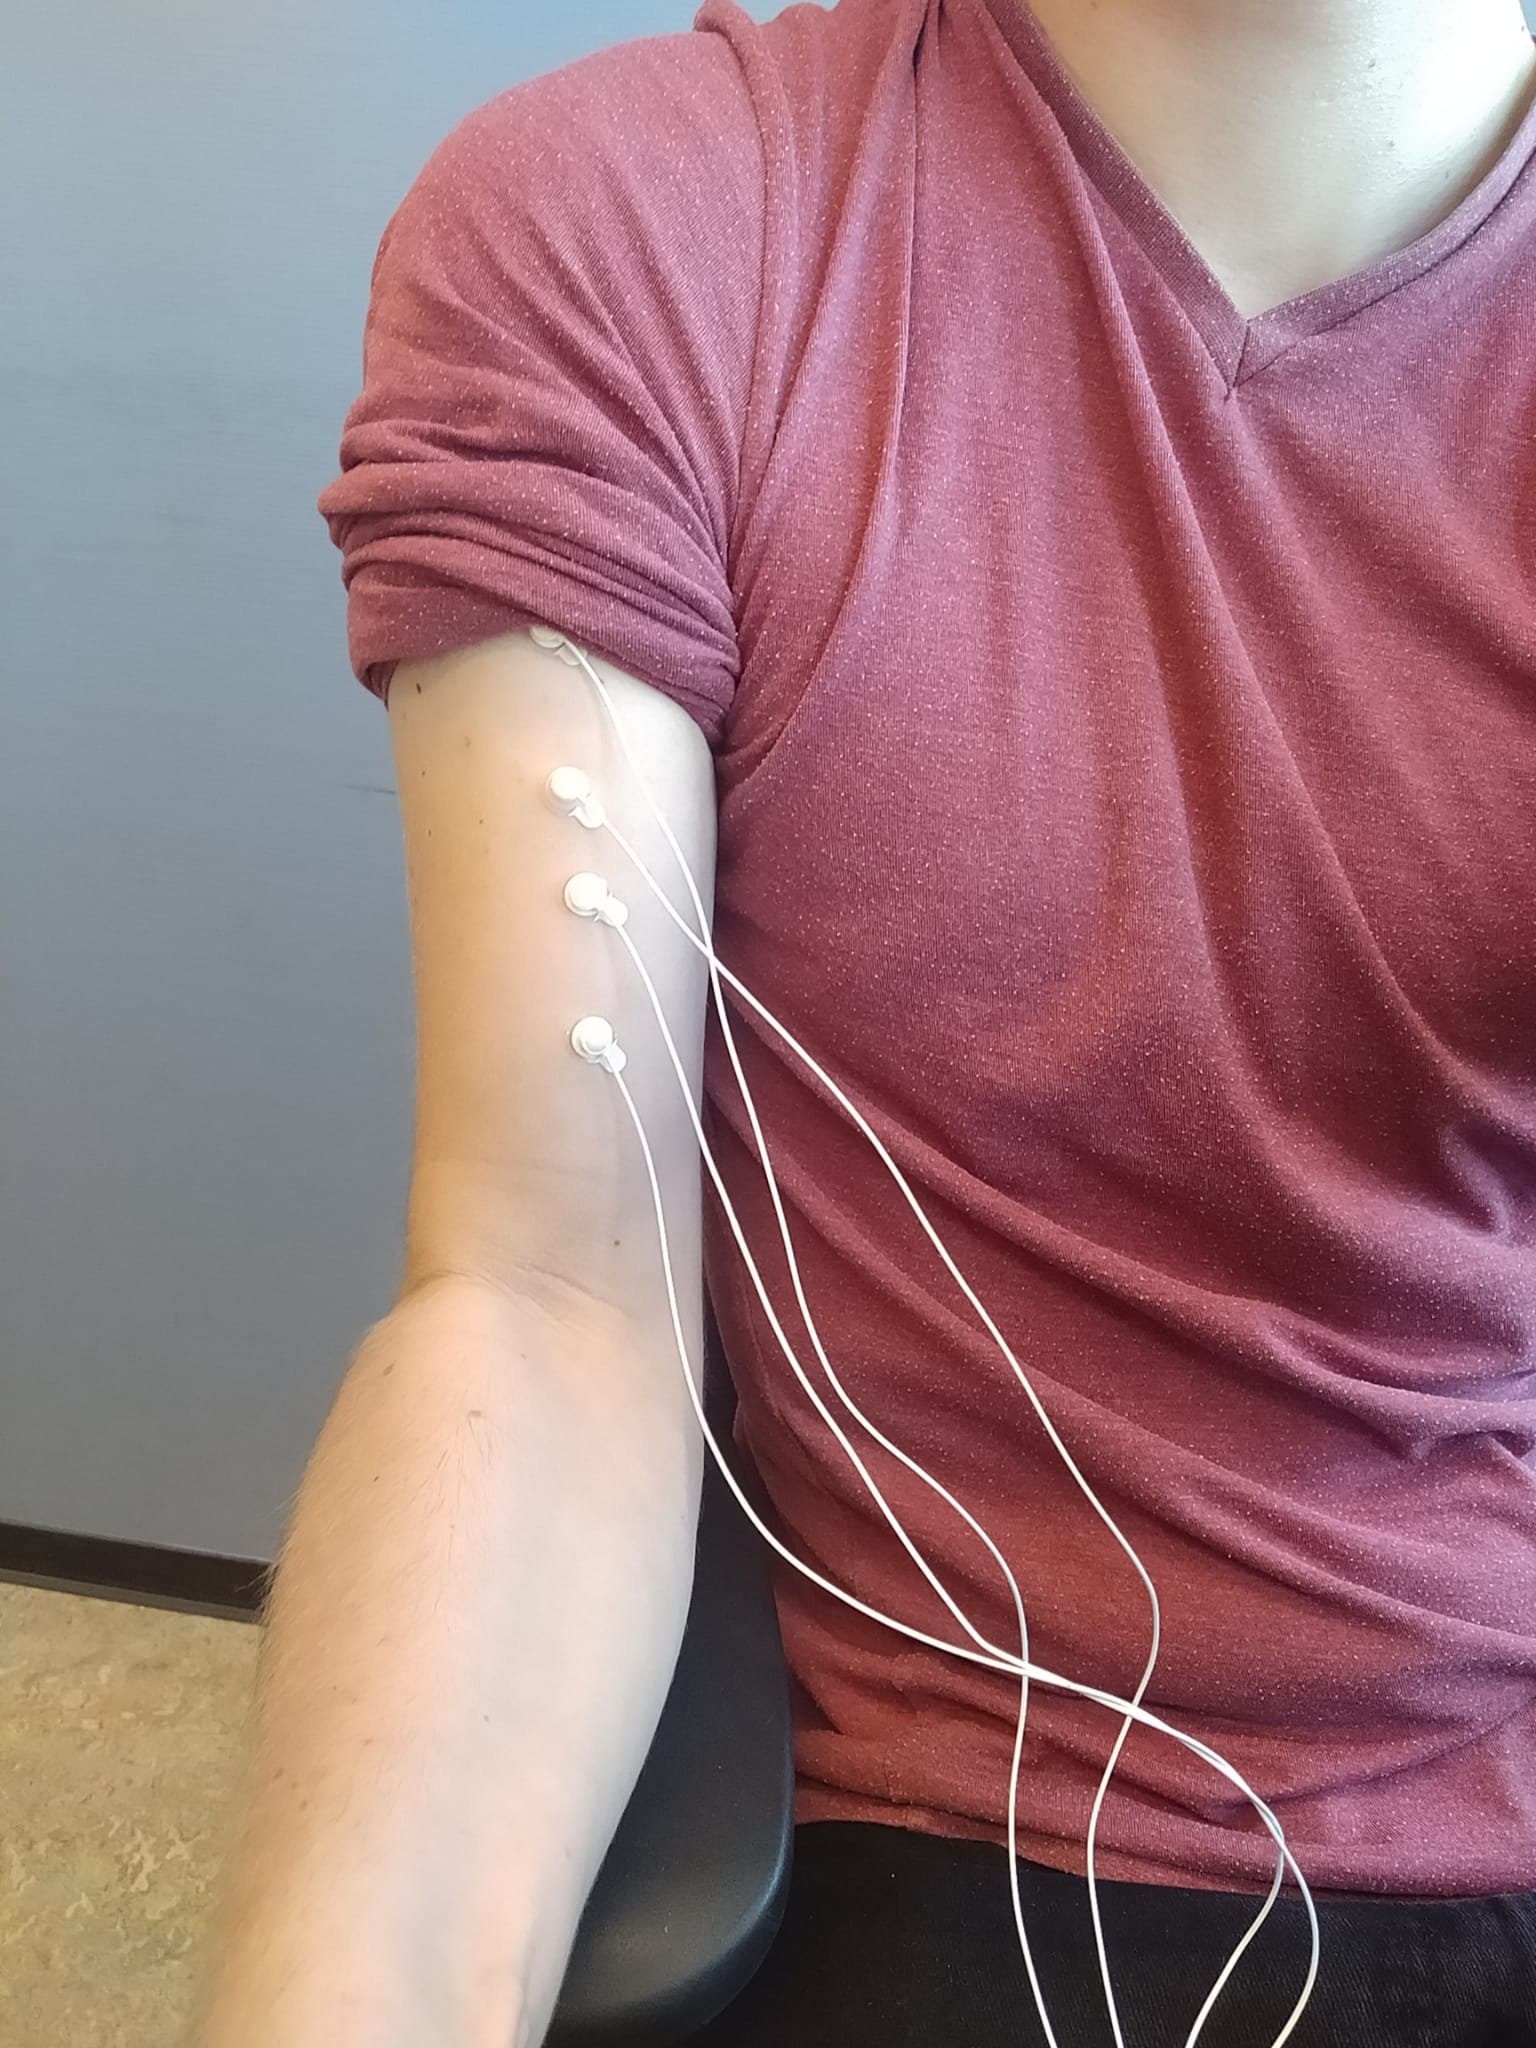
Figure 1: Placement of the 4 electrodes on the upper arm to measure the impedance of the bicep brachii.
Measurement frequencies
The measured muscle impedance is influenced by many factors, e.g. muscle length and width, amount of blood in the muscle and the (de-)polarization of the muscle axon’s. [2, 3] When an isotonic contraction is performed the muscle shortens due to the movement which is barely possible in an isometric contraction. However, in both cases the measurement should indicate that the muscle is contracted. This study showed that during an isometric and isotonic contraction the resistance decreases. The same holds for the reactance when the measurement frequency is lower than 50kHz. However, when the impedance is measured above 50kHz the reactance increases when a contraction is performed. Using 2 measurements below and 2 above 50 kHz it should be possible to distinguish a contracted muscle from a relaxed muscle in different situations.
Data processing
Even though using multiple frequencies it is possible to distinguish a contracted muscle from a relaxed muscle it is cumbersome to come to an equation that is not only able to distinguish muscle contraction but also to do this in different arm positions. Therefore a neural network is introduced to find a relation between the various measured impedances, muscle contraction and arm movement. The neural network is trained using 8 inputs, the resistance and reactance measured at 4 frequencies. The training targets of the neural network are both the arm position and the amount of muscle contraction. The arm position is indicated by the angle of the elbow which is either 90 or 180 degrees. The amount of muscle contraction is indicated by an EMG signal which is measured simultaneously with the muscle impedance signals. Both target signals are normalized between 0 and 1. An example of a movement pattern including an isometric and isotonic contraction is given in figure 2. The corresponding measured resistance and reactance are given in the same figure.

Figure 2: The measured resistance and reactance during 4 different arm states. State “D” pushing towards the shoulder. “C” relaxing with the hand up. “B” pushing against table top. “A” arm relaxing on arm rest.
Results
The movement pattern of figure 2 is performed multiple times, from “D” to “A” as well from “A” to “D”. The neural network (NN) is trained using all the datasets of these measurements. One of the results of the trained neural network is given in Figure 3, together with the arm movement (bottom plot). The top plot shows the normalized EMG target signal and the output of the NN. As can be seen is have the target and the output of the NN a higher amplitude during contraction. The middle plot shows the movement of the arm. The arm is either in position “0” or “1”. The NN is able to recreate the target very well.
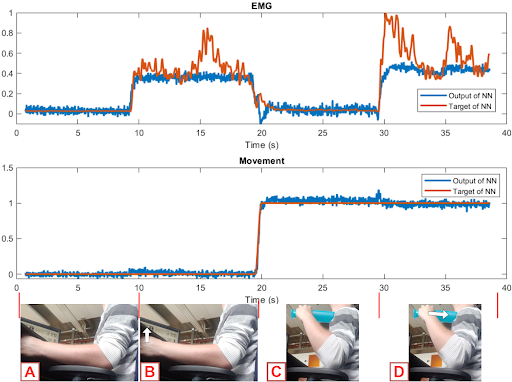
Figure 3: Bottom, the performed movement pattern with the 4 different states. Middle, the arm position target and output of the NN. Top, the normalized EMG target signal and the NN output.
Conclusion
Finally two conclusions can be drawn from the results shown in Figure 3. Using the impedance measurements measured at 4 different frequencies it is possible to distinguish a relaxed muscle from a contracted muscle even though the arm is in different arm positions. Secondly, it is possible to distinguish these different arm positions as well. Therefore EIM is a promising candidate for the control of a robotic hand.
[1] W.Williams, “Bionic hand price list.” https://bionicsforeveryone.com/bioni
c-hand-price-list/.
[2] L. T. L. Fiuza, “Feasibility of eit measurements of functional muscular activity
as control signals for prosthetics,” Master’s thesis, University College London,
k.aristovich@ucl.ac.uk, 8 2018. Department ofMedical Physics and Biomedical Engineering.
[3] A. Liston, R. Bayford, and D. Holder, “A cable theory based biophysical model of resistance
change in crab peripheral nerve and human cerebral cortex during neuronal depolarisation:
implications for electrical impedance tomography of fast neural activity in the
brain,” Medical and Biological Engineering and Computing, vol. 50, pp. 425–37, 05 2012.
Copyright - International Federation forMedical and Biological Engineering 2012.